Between late summer and end of harvest every year, the NuTech team crunches a huge data set, looking for trends and outliers to lead the way to increased potential.
Measuring performance starts earlier than you might think. In mid-July, Scott Davis, warehouse/supply lead, and Brad Johnson, agronomy lead walk lots of corn and soybeans, collecting notes on their iPads and clipboards. In late August, spreadsheets and calls trickle in with initial product performance reports. Harvest marks the culmination of a long season for NuTech customers, but for Davis and Johnson, it’s just the beginning of analysis and evaluations. Sorting reams of data quickly can be challenging, but it’s necessary for customers to get new product advancements, so Davis spends countless hours leading the analysis efforts that guide them.
Davis has 31 harvest seasons under his belt, and product performance is front and center. “I never thought of myself as overly analytical, but early on in my career, I was always fascinated with product performance,” he says. “I’m blessed with the ability to process numbers, lots of them at times. But performance data can be really overwhelming!”
When Davis started in the seed industry, data was gathered sitting in the combine during harvest. “I remember the days before yield monitors and maps, counting rows, rounds and gauging the grain tank, figuring performance as soon as I could,” he recalls. Now the analytics in the cab are fast and make local performance data instantaneous, but verification with other internal and third-party data is needed to determine if an event is an outlier or a result that farmers can expect.
Dealer plots and side-by-sides, supported by third-party and internal research results, have formed the foundation for evaluating product performance at NuTech. The perennial challenge has been organizing and evaluating the data. Davis once wrote a spreadsheet macro to average and rank hundreds of varieties in a local replicated experiment. It took hours to run and Davis thought, “There has to be a better way.” The Excel PivotTable function processed the same statistics in under 30 seconds, but even that would be unacceptably slow by today’s computing standards.
Internal testing at Corteva Agriscience generates an incredible amount of data from thousands of potential products in hundreds of locations over many years. NuTech’s side-by-sides and strip trials, coupled with robust third-party testing, add thousands more data points. Fortunately, Davis and Johnson are able to also rely on the resources and systems available from Corteva Agriscience to support thorough analysis. “We have some of brightest, most talented people in the world working for Corteva in product development,” Davis notes. “From breeders to statisticians to programmers, they all work tirelessly behind the scenes to develop products and tools to make our product development process easier.”
“I remember times when I wished I had more data. Clearly that isn’t the problem anymore” comments Davis. NuTech’s new product selection process inputs include charts, bar graphs, scatter graphs, Finlay-Wilkinson analysis, geo-mapped points, color-coded maps, regression analysis and pivot tables. Then Davis and Johnson overlay the data with their notes from research locations. They say that, even with all the tools and analysis, there’s no substitute for experienced eyes. “Data summaries are great, but we need to make sure they align with our personal observations from the summer,” Davis notes. To help whittle down the data, the team focuses on the specifics, primarily within the NuTech footprint. They consider other national data for trends, but with hundreds of data points right in the NuTech area, there’s ample data to make good product decisions with high probabilities for success.
For NuTech customers, the bottom line from all of this data is confidence. Over the past few years, performance increases for NuTech products have been remarkable, helping NuTech live up to its “expect performance, deliver performance” objective. As the product advancement team, Davis and Johnson focus on delivering performance so that customers can expect great things from their fields. “Starting out by walking fields gives you a strong basis of understanding the performance, and then confirming with the analysis is the rewarding part,” Davis says. “Our products are making incredible performance jumps and truly taking us to new levels.”
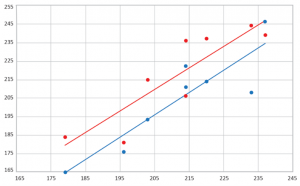
Head to head comparisons are reviewed using a Finlay- Wilkinson analysis, which compares two products across different yield environments.
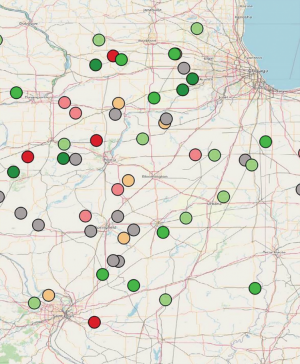
“Green is good!” Scott Davis, warehouse/supply lead, works diligently each year to analyze NuTech performance results and interpret them in easy-to-understand visuals like this one, reflecting product performance in various locations.